Kubevious: A Developer Centric Dashboard for Validating Kubernetes Configuration
Deploying applications to clusters in the Kubernetes has multiple components that can make simple actions very inefficient. To understand what is going inside the Kubernetes cluster. The official Kubernetes community has created a general-purpose dashboard to easily navigate through different objects and namespaces by getting an overview of all the resources and configuration relevant to the application.
However, the Kubernetes dashboard provides enough features for grouping cluster information. It lacks customizability for different cluster environments. To address this concern, we have open-sourced Kubevious, a developer-centric Kubernetes dashboard, to better understand the state of applications inside the Kubernetes cluster.
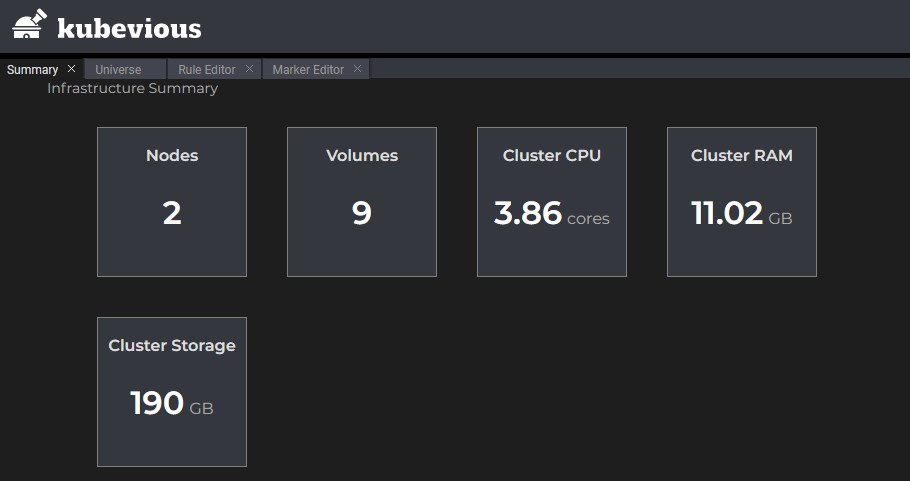
 Kubevious has many capabilities, but in this blog, we will focus on its dashboard based features, which allows you to easily manage and view Kubernetes components. Kubevious is an open-source Kubernetes dashboard that helps developers easily view and manage their Kubernetes resources running on a Kubernetes cluster. Users can render all the Kubernetes objects, namespaces, dependencies, and configuration relevant to the application in a single point of view, allowing easy elimination of unnecessary labels and settings.
Moreover, Kubevious capabilities can be deployed to any Kubernetes distribution without installing or authoring a plugin to view or mark Kubernetes components. Kubevious dashboard implements what it’s called a universe/navigation tree, which displays objects type grouped by namespaces running in a cluster.
Users can easily view objects like cron jobs, daemon sets, deployments, services, and pods, listed as endpoints for different groups. Also, for every group, Kubevious loads the resources list and shows the usage per object. It provides an absolute resource value so developers can identify which resources are taken by each container, deployment, or namespace relative to node or cluster.
Custom Validation Rules Support


The syntax includes a Kubernetes resource and a marker, which includes the action for that particular resource. Markers can be of any type, such as icon, name, and colour, for tagging resources. Once the rule is set, there are no additional tools required for management; Built-in rule editor takes care of rule storage by securely saving them in the cluster. There is also a library of pre-defined rules such as Pods without Limits, Resource usage specifiers, providing organizations with easy to use policies to enforce custom requirements.
Custom Rules Crosschecking
After creating a custom rule for a resource, Kubevious determines whether the resources available match the desired rule. The dashboard provides a direct report on the list of affected resources before implementing that particular rule. This is helpful in scenarios where developers have encountered an error after changing a configuration in a deployment.
Having a list of resources affected by the change in configuration can help resolve those misconfiguration issues. Other than the list of affected resources, Kubevious also detects and lists shared data and dependent objects between resources. For Instance, Users can easily see which objects are taken a particular service, network, or service account in one place, which can help decrease the cascading effects of misconfiguration even further.
Easily search Deployment Configuration
Kubevious supports full-text search across the entire cluster, which means users can quickly look for a particular configuration in a cluster without wasting any time. As it is also very easy to make errors when configuring Kubernetes components, Kubevious uses red circles, which contain the number of errors for that particular configuration in that subtree.
Additionally, Navigating a particular or older configuration is also very easy in Kubevious because of its Time Machine capabilities, which allows users to look at the previous configurations so they can easily track and identify the issue with current misconfiguration.
Automatic Resource Marking
Another feature of the Kubevious dashboard, which stands out, is its ability to perform automatic marking on different resources based on the custom or built-in rules defined. Instead of running manual kubectl commands, users can easily view the configurations, which have to be debugged with a simple click on the Kubevious dashboard. Many markers come prebuilt into Kubevious. For Example,- Kubevious can mark objects with API access outside of the namespace, which can decrease security vulnerabilities.
Unused cluster binding can also be found, so no users across the cluster are granted more permissions than they are entitled to. Privileged workloads/containers that can run with escalated permissions are marked as radioactive as unauthorized access to these workflows can make the entire cluster unstable. Role-based permissions can also be viewed and marked easily through correlated Role-Based Access Control(RBAC), which provides support to explore all the role bindings, applications, and service accounts running in the cluster in a single place.
Kubevious makes use of a single role matrix that combines permissions across all RBAC components to be easily identified and marked for applied pods. For instance, service accounts are marked with shared flags to determine whether they are shared with other applications. If you want to learn how to format text to MLA via google docs then click here.
Conclusion
To start using Kubevious, Users have to run it inside the cluster to execute the above capabilities appropriately. It can also be deployed using Helm. Alternatively, users can have a look at the installation options by visiting the Deployment Repository. Kubevious provides a vast range of features if the Kubernetes monitoring dashboard is not meeting your business needs. It’s free and open-source, and it is effortless to use with your Kubernetes workflows. See https://kubevious.io/ for more information.


